Building Isometric Seattle
This week, I built Isometric Seattle: a 3.5-gigapixel illustrated map of my hometown, with live buses and ferries.
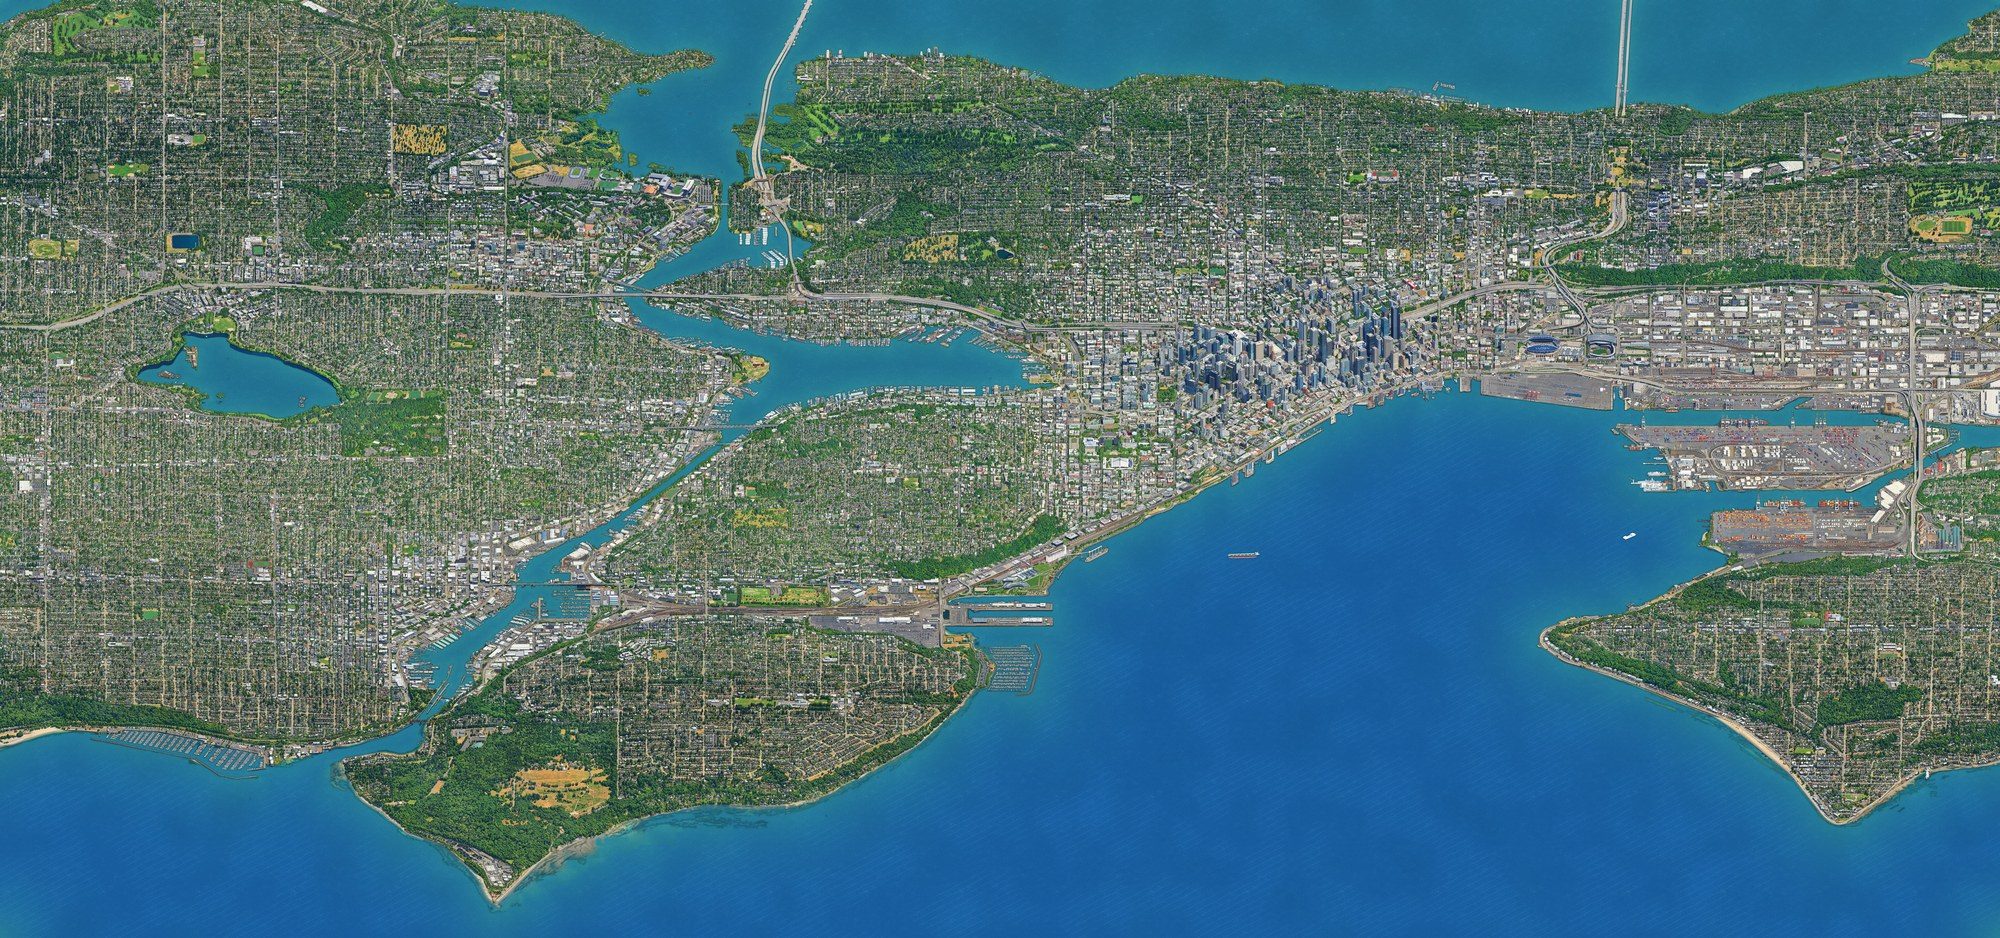
I tweeted about it and got some decent engagement (for me), so I wanted to take some time to write up how I did it.
I’ve been trying to do more ambitious things with AI, especially projects I wouldn’t ordinarily know how to start. I’d seen a few isometric city maps on twitter in the last week, noticed that there wasn’t one for Seattle, and figured I could try and close that gap (I also wanted to channel my innner Fran Lebowitz).
This entire project was me driving Claude, but the point of this post is to point out some things I learned about the process so that future projects don’t have to ideate on this from scratch.
Nailing the rendering strategy
My first attempt combined LiDAR heights with aerial photos to get a grey isometric render of downtown. This gave me a decent city shape (and was free!), but the details were super sparse.
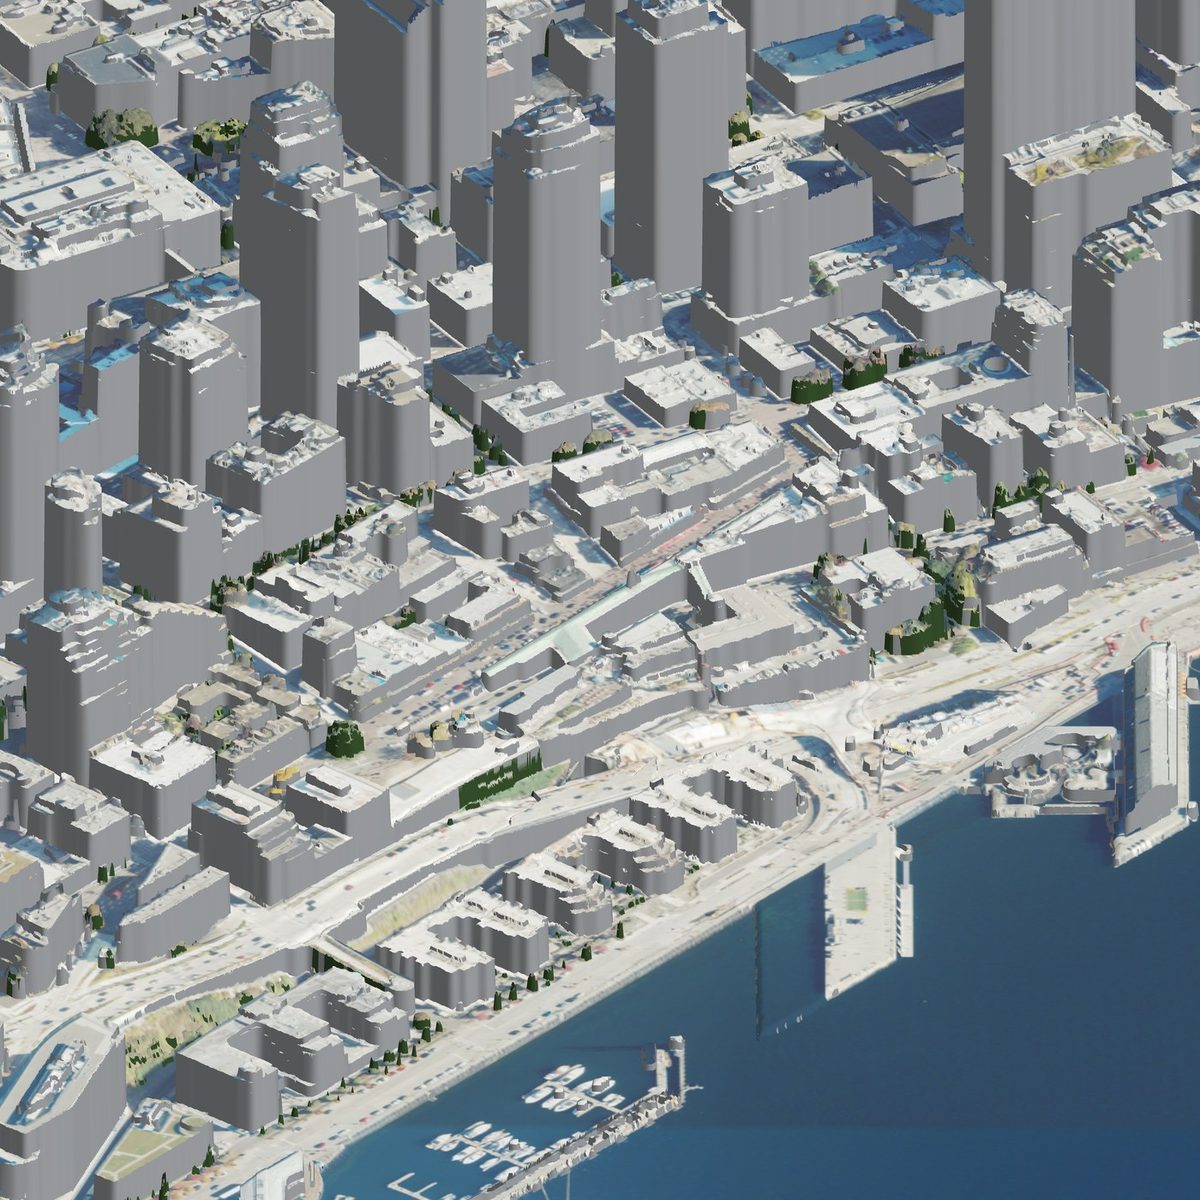
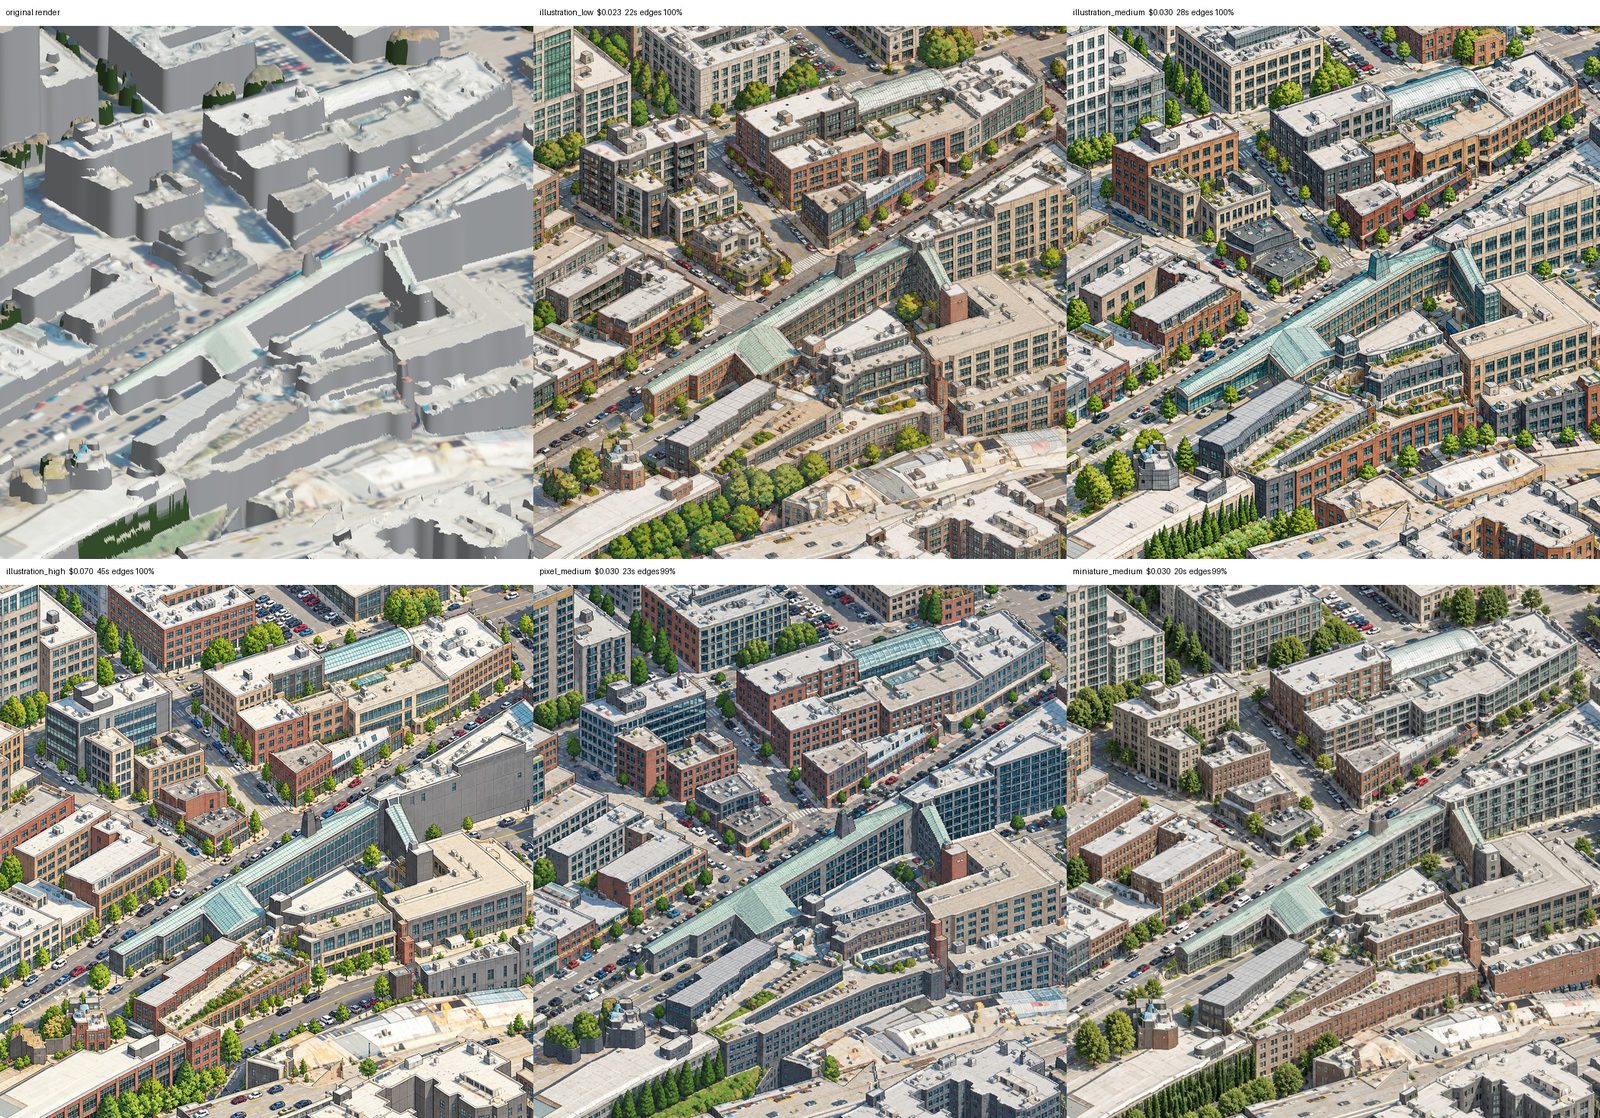
Still, I had enough of shape to test out some art styles on it, so I tried a few, and illustration_high was my favorite.
I also noticed that drawing adjacent tiles independently left obvious gaps between tiles. To fix that, I used overlapping “windows”, i.e. tiles drawn in waves, where later windows see their finished neighbors and continue the drawing.
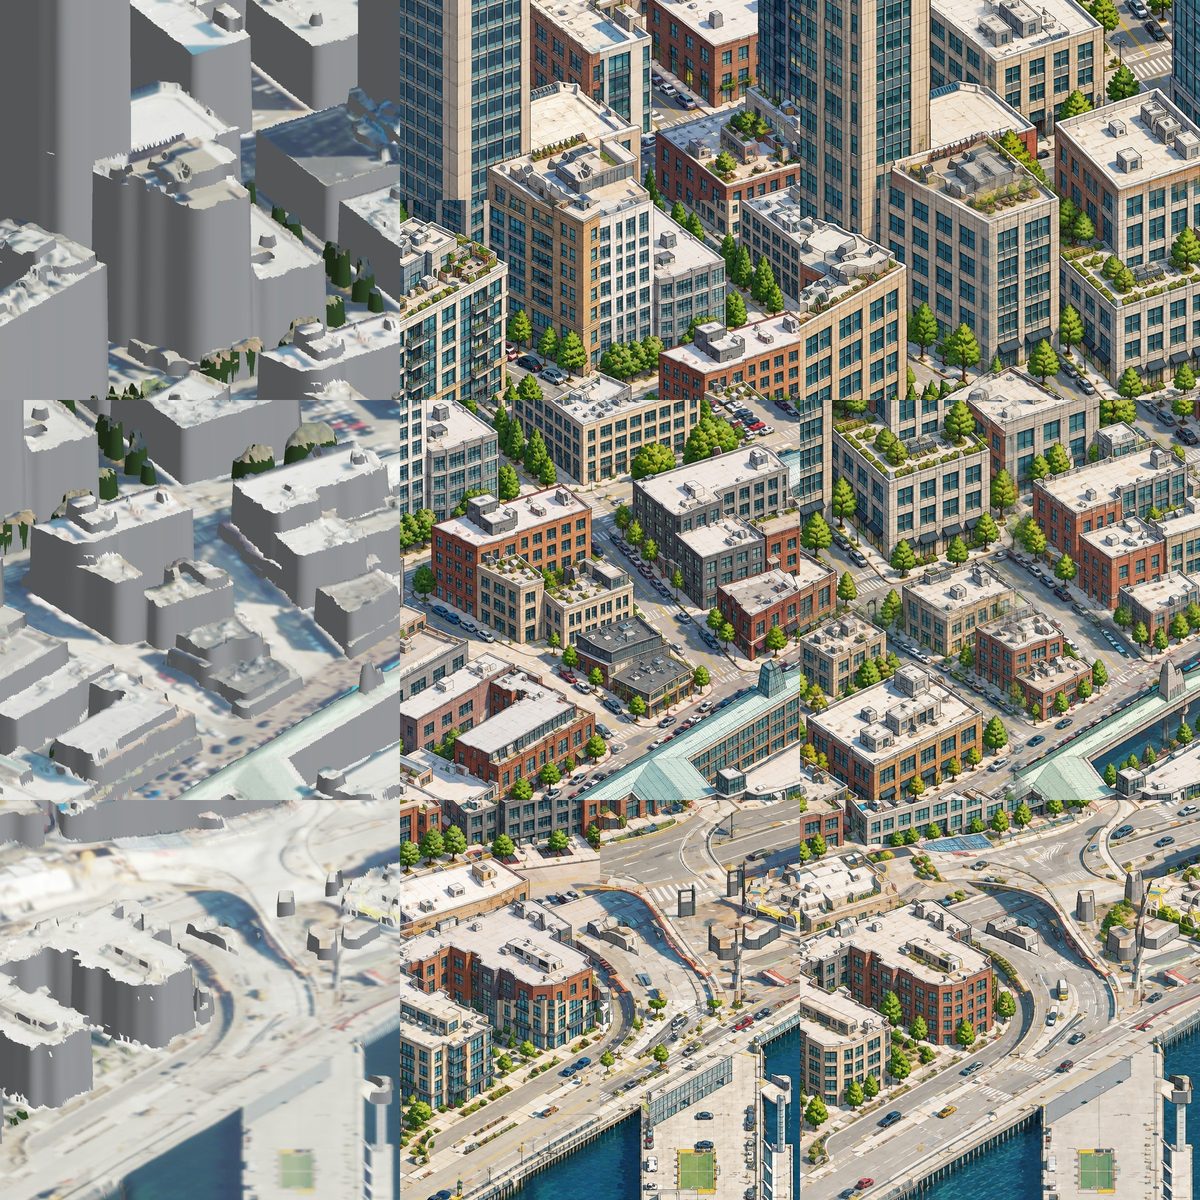
Once I got my tiling overlapping + illustration style sorted, though, I needed to fix the hallucination problem. As the real Seattle-knowers could probably tell from the first few images, the model was inventing too many fake details about the buildings it was trying to draw when only using the LiDAR data. I needed a better source. Fortunately, I was able to use Google’s Photorealistic 3D Tiles to build a much more robust rendering – this service gave me textured facades, trees and detailed geometry to trace instead of blank grey walls.
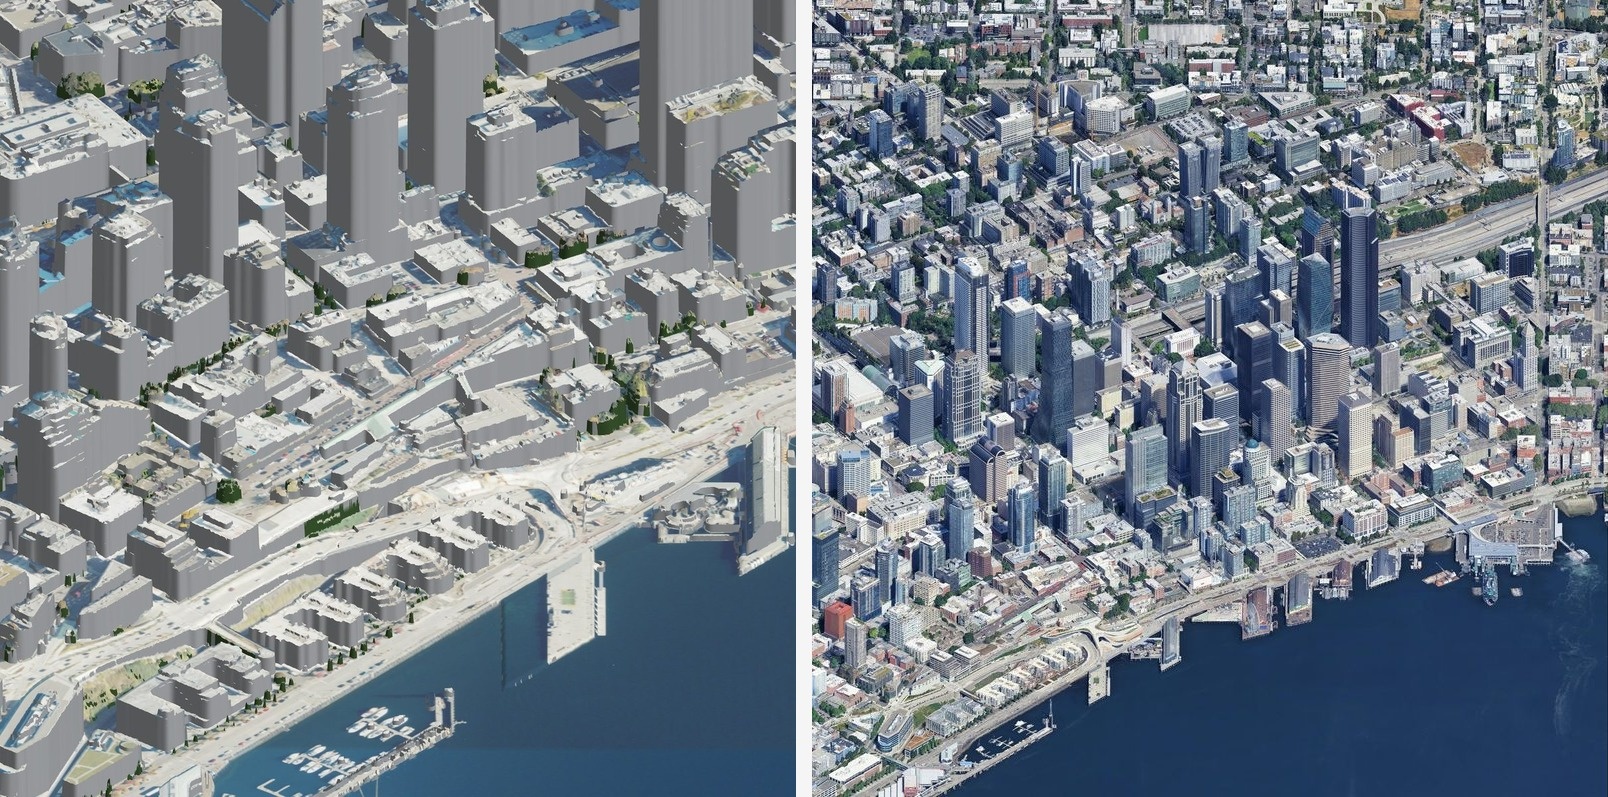
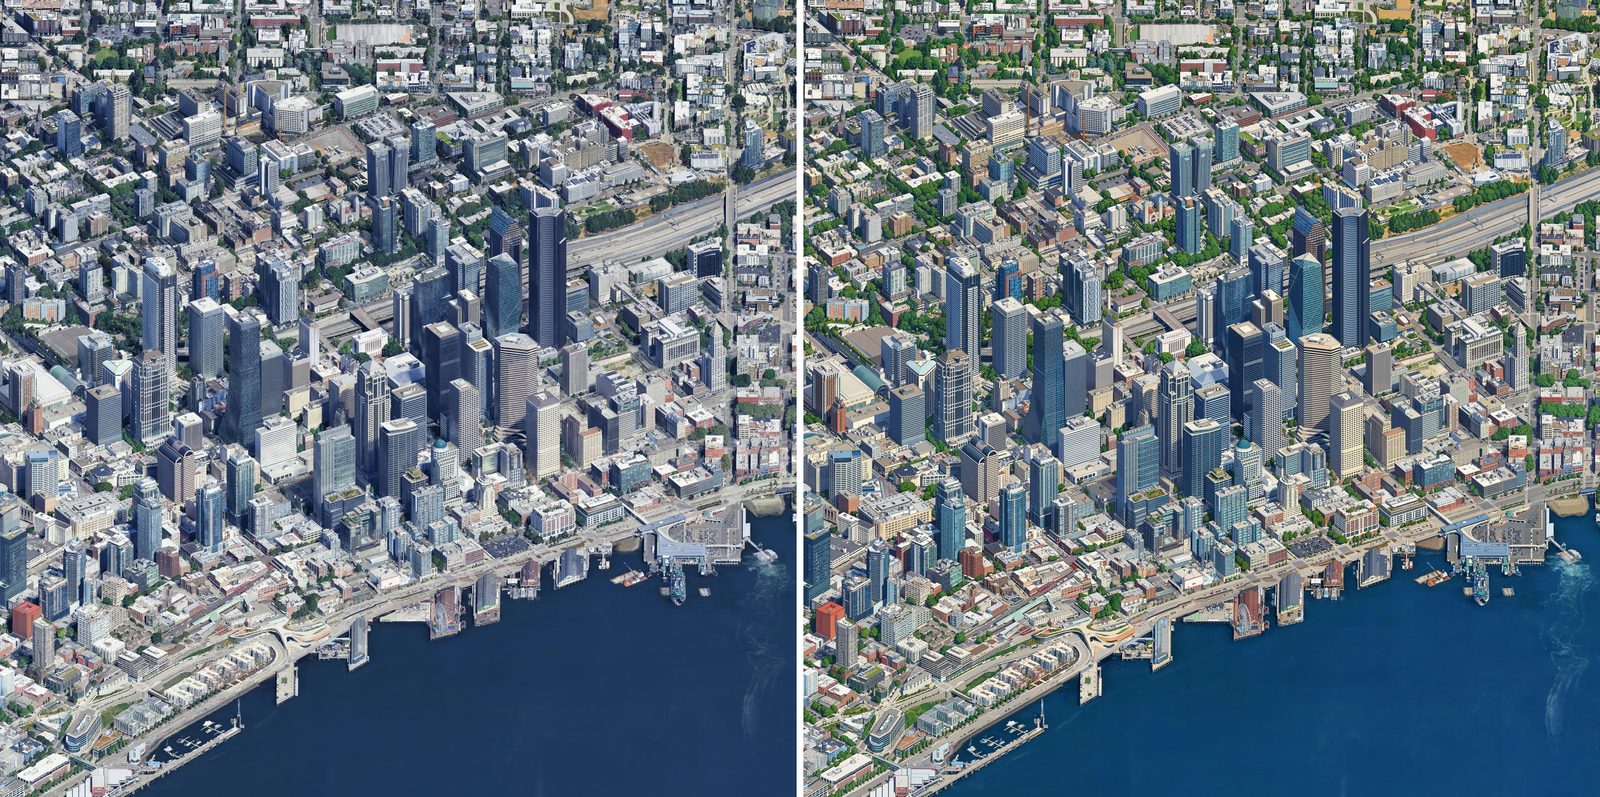
This let me modify my prompt to do more tracing and less generation, the tl;dr was: preserve the buildings and their positions, and change the drawing style to be illustation_high instead of the photorealistic image. Each result gets checked against its source and retried if it drifts.
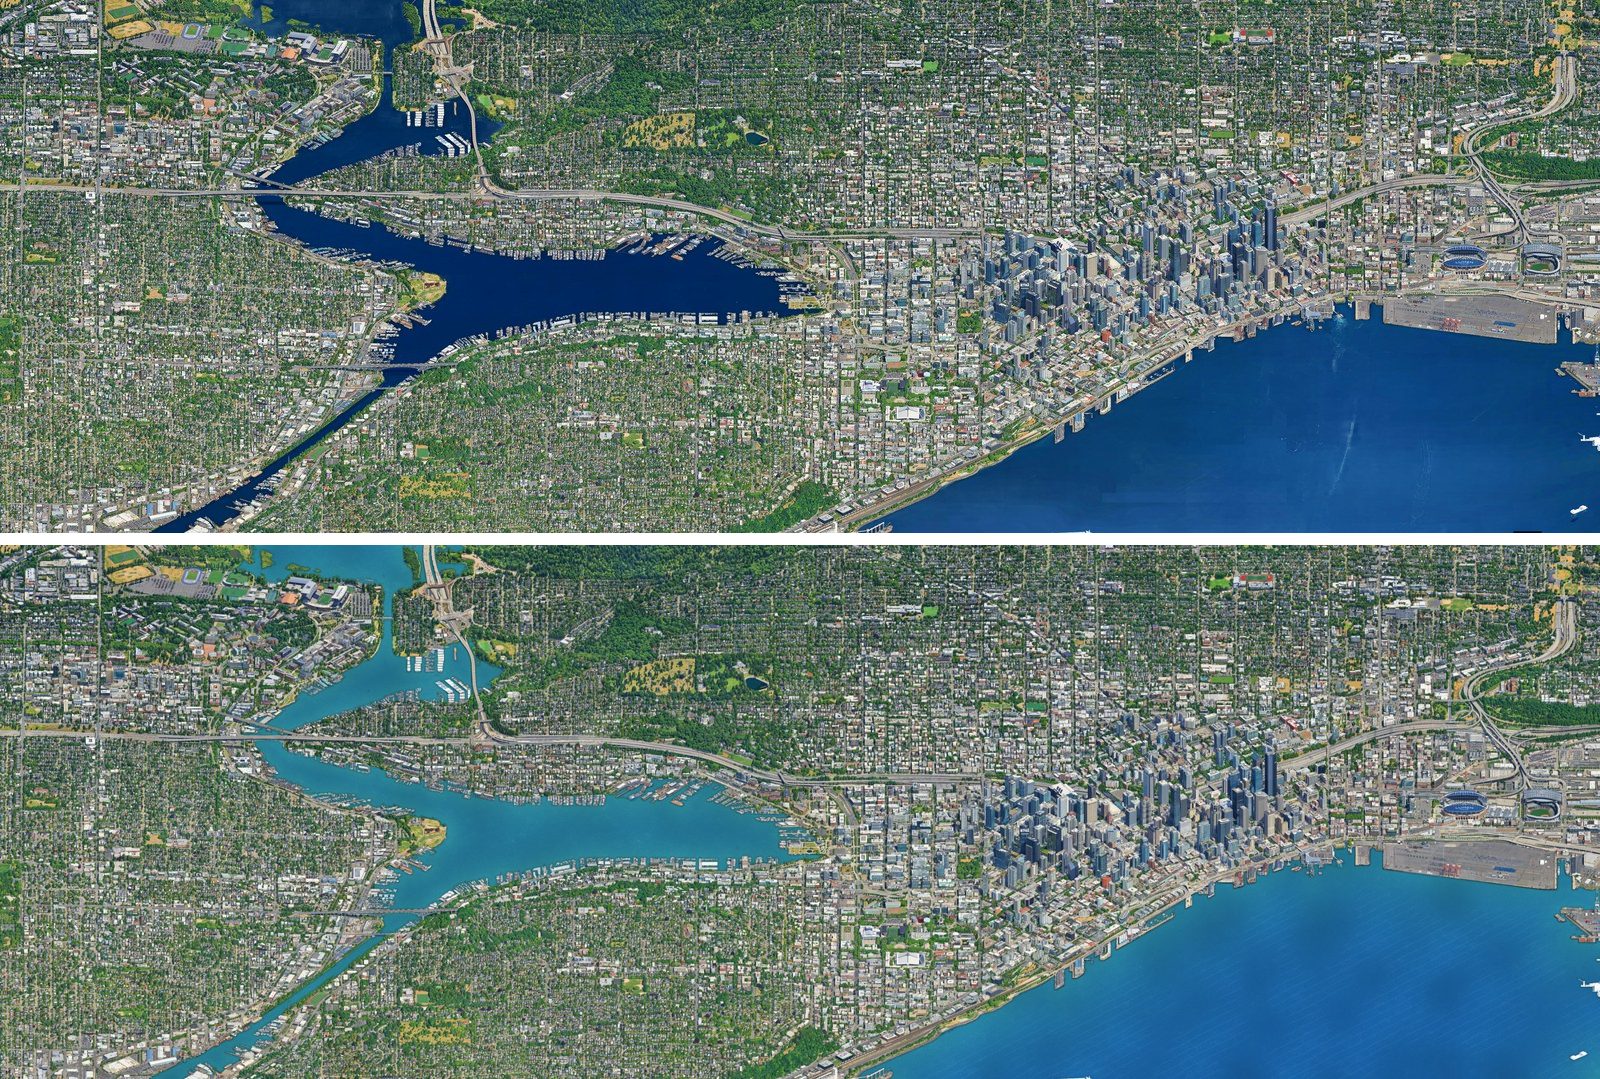
Another problem I had was rendering water. Google’s source had patchy coverage, and asking the model to redraw it wasn’t helping. I stopped sending mostly-water windows to the image model and repainted the water in one consistent style. Boats needed manual touchups.
Giving pixels coordinates
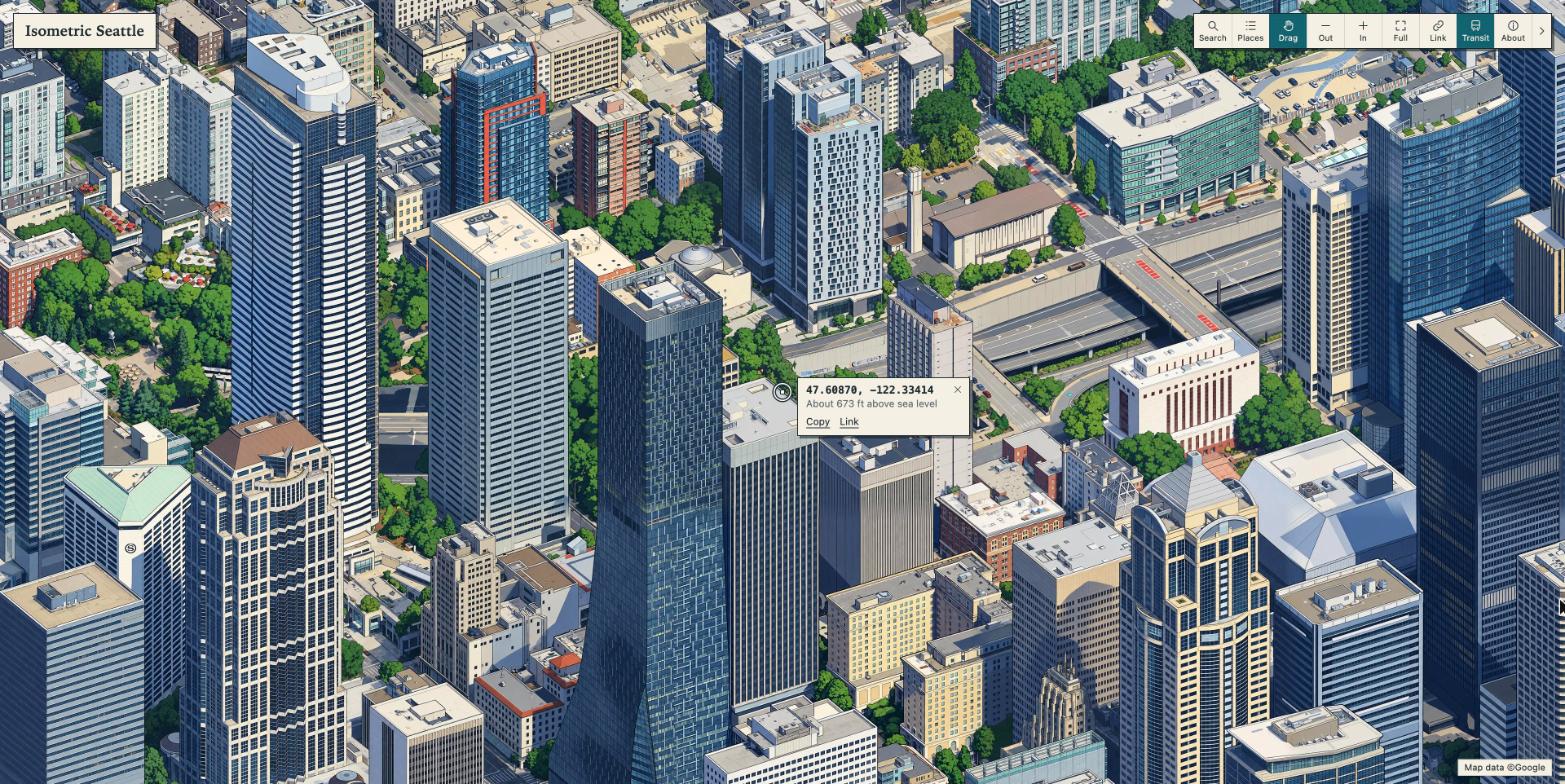
Next I wanted to do location search, and give users a way to see where a point on the map actually was.
The source render already had a depth grid, whcih I could combine with the camera geometry to give each pixel a latitude, longitude and height. That turned out to be enough enough to place search results, show coordinates, and it laid the groundwork for putting put transit on the right streets (and bodies of water).
Adding transit
I pulled live vehicle data from King County Metro and WSDOT’s ferry API, then made custom bus and ferry sprites because I didn’t like the default blocky ones.
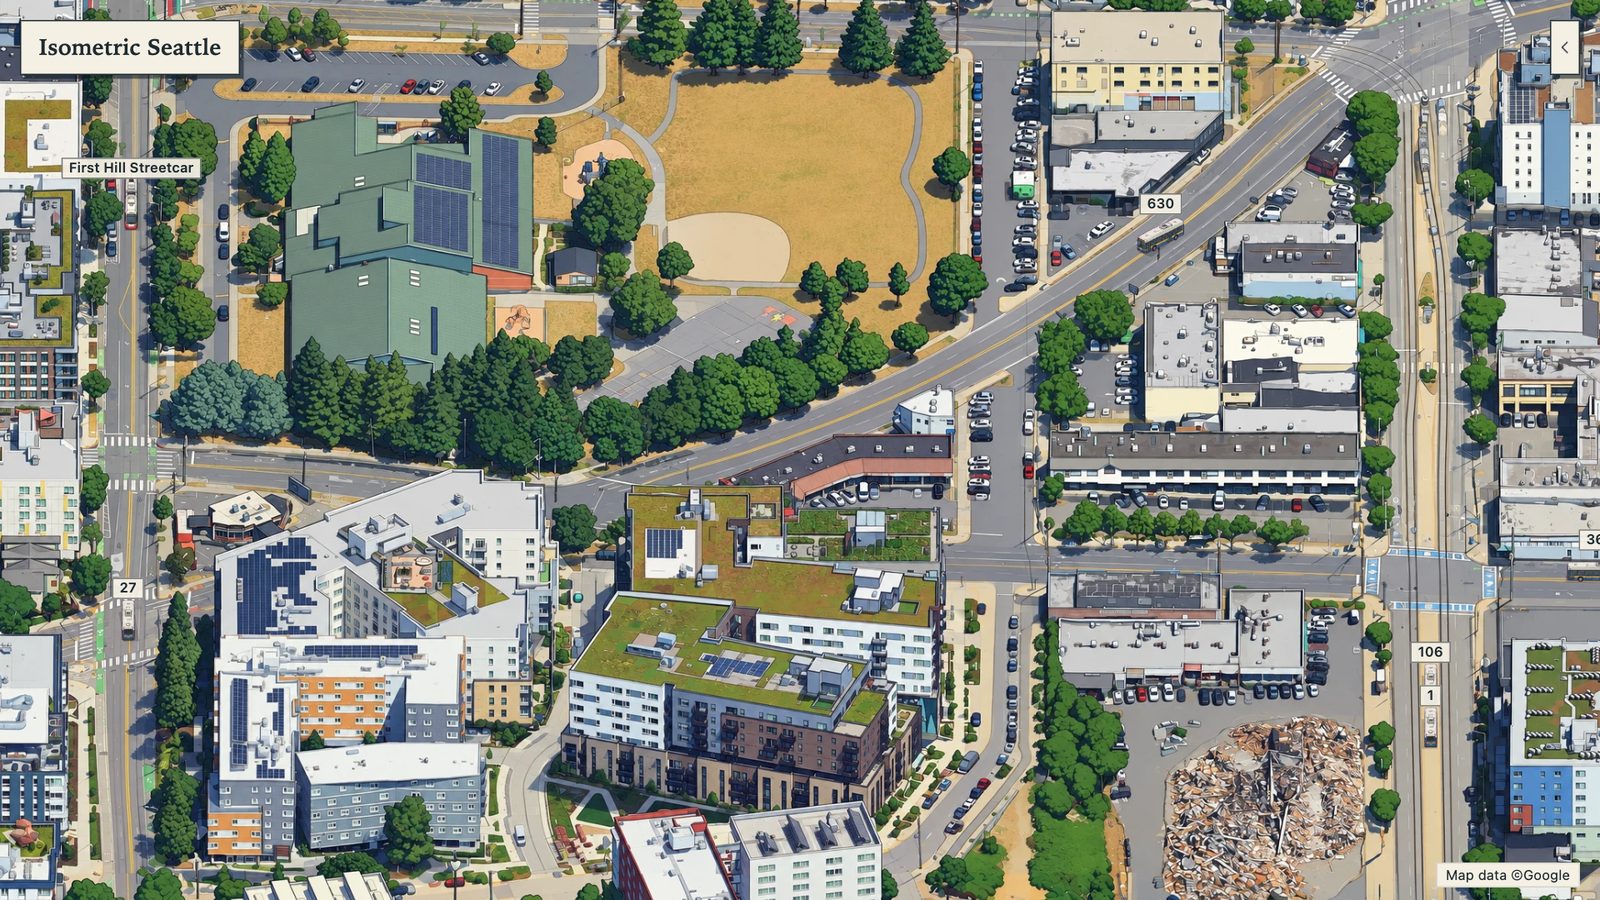
I had to engineer around the actual data feeds a bit (the bus feed updated roughly once a minute, without any sort of heading), so to make the routes look smoother, I:
- Laid the route over the map.
- Played reports back two minutes behind real time.
- Added glide along the route between updates.
- Hid vehicles (read: made them disappear from the map) behind trees, buildings and tunnels.
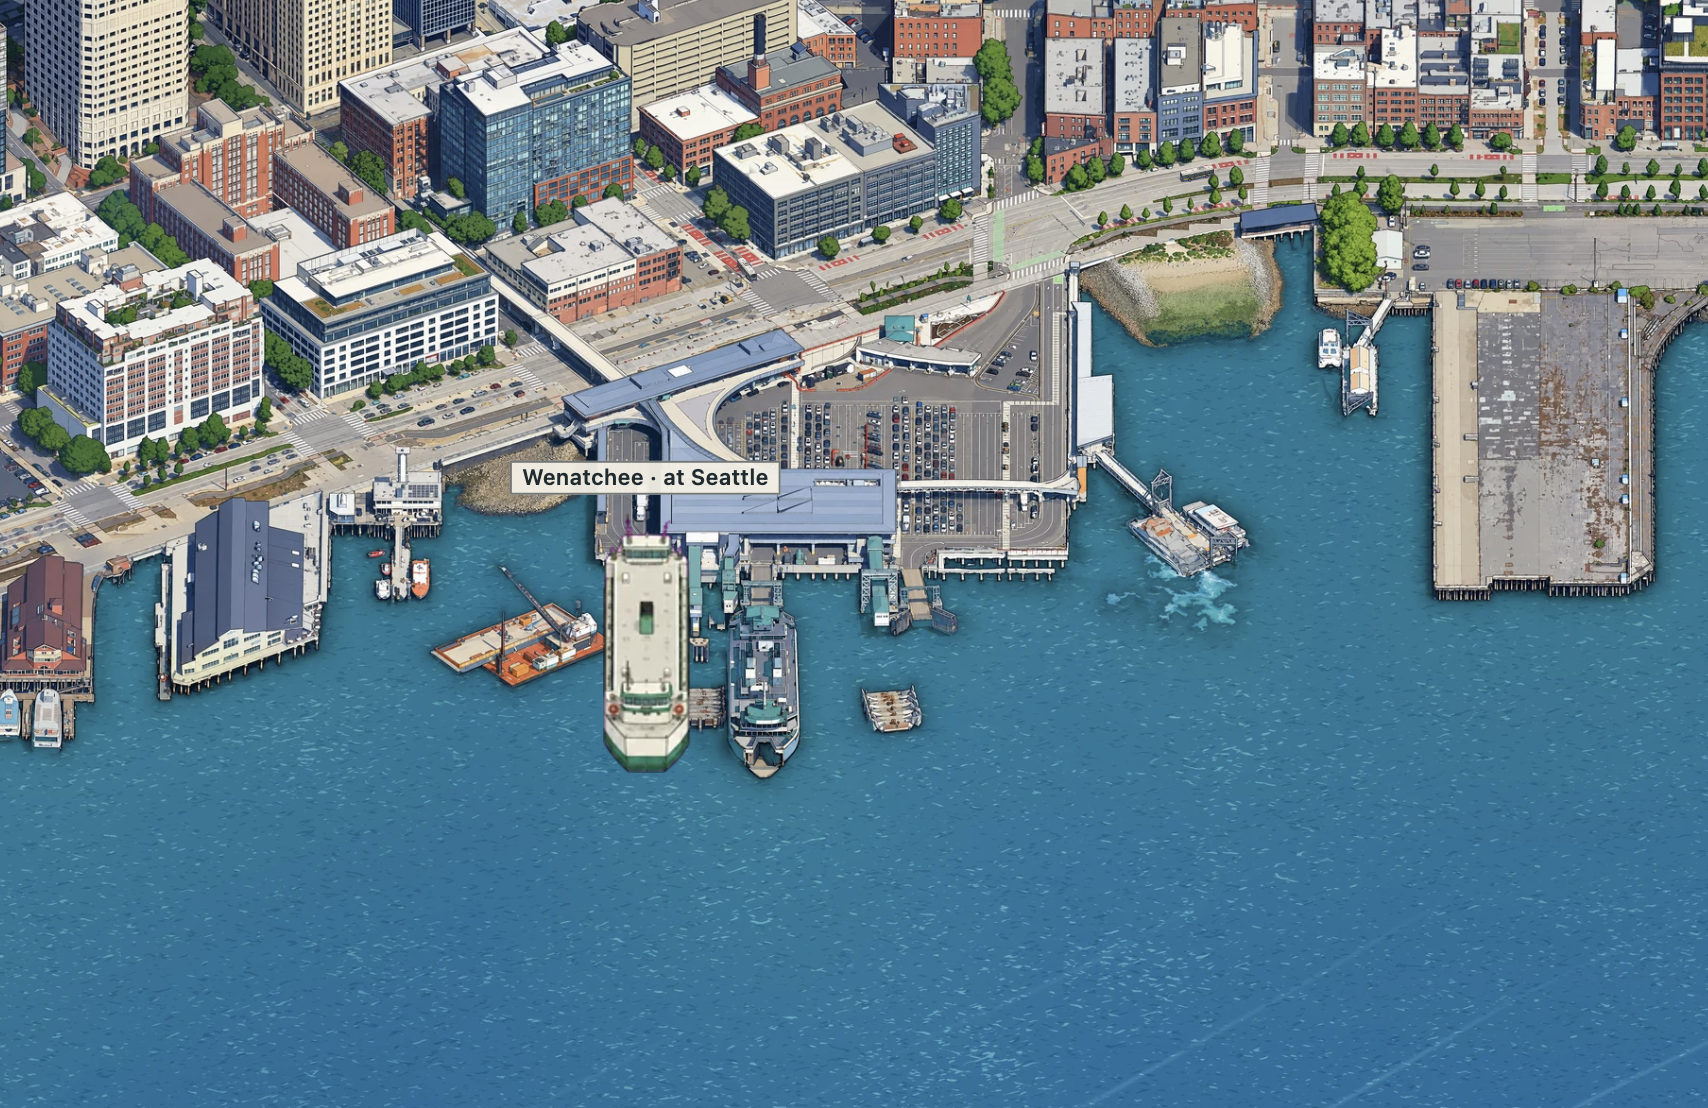
Ferries were easier to render since their route was over open water, all I had to do was add some extra handling near the docks so they didn’t sit there awkwardly.
I also tried simulated car traffic, but I dropped it (for now). It was cool, and made the map loop alive from a distance, but when I zoomed in it looked too busy, and too chaotic for my taste. Cars were leaving roads, failing traffic lays, disappearing and popping in a lot, and it was a pain to make a variety of sprites that I was happy with. Buses still have some of these issues re: traffic patterns, but there are fewer of them. I want to bring cars back if I can get them to behave.
Image generation pipeline
Claude wrote all the code and I didn’t read it, but for anyone interested in the architecture, here’s the “pipeline” (it’s a series of python scripts).
flowchart TD
    render["`**1. Render the city**
Google 3D Tiles → image + depth
Save depth for map coordinates`"]
    trace["`**2. Trace the illustration**
Draw overlapping image windows
Check each result; retry if needed`"]
    clean["`**3. Clean up the drawing**
Repaint water and repair seams
Match colours across the map`"]
    place["`**4. Map pixels to real places**
Image + saved depth → coordinates
Locate landmarks and transit`"]
    serve["`**5. Serve the map as tiles**
WebP tiles at multiple zoom levels
OpenSeadragon on Cloudflare Pages`"]
    animate["`**6. Add live transit**
Routes + live reports → vehicles
Smooth movement; hide behind trees`"]

    render --> trace --> clean --> place --> serve --> animate
Hover over a step, focus it with the keyboard, or tap it for details.
-
Render the city.
google_big.pyturns Google 3D Tiles into an image and a matching depth grid. The camera faces east, tilted 30° down, at 0.165 metres per pixel. Overlapping chunks are cropped to avoid joins, and a depth sample is saved every 8 pixels for step 4. -
Trace the illustration.
full_map.pydraws overlapping 1024-pixel windows, spaced 683 pixels apart, in non-touching waves. Finished neighbours and a style reference guide each drawing. Each result is scored against aligned and shifted renders, with up to two retries. Windows that are at least 97% water are skipped; the job is budgeted and resumable, without duplicate payments. -
Clean up the drawing.
clean_water.py,patch_map.pyandtone_match.pyrepaint water, repair drift and match bridge tones. Water follows Overture outlines, with map-anchored chop that joins across chunks while preserving wakes and pier shadows. The work runs in chunks because it needs about 96 GB per gigapixel. -
Map pixels to real places.
height_grid.pyuses the saved depth grid to find each pixel’s latitude, longitude and height. A pixel in a tilted image is a ray, not a location; the 1/8-scale depth grid tells you where it lands. This powers search, coordinate popups, landmarks and transit placement. -
Serve the map as tiles.
build_viewer.pyexports 4,502 WebP tiles, each 1024 pixels across, in a Deep Zoom pyramid. OpenSeadragon displays them on Cloudflare Pages. The tile folder is versioned asmap7to avoid stale caches. -
Add live transit.
build_transit.pyandtransit.jscombine routes with live reports to move vehicles. Route points every 10 metres follow street or freeway height; drawn leaves and depth-grid obstacles hide vehicles where appropriate. Buses play two minutes behind their real reports. The only server code is two Metro and WSDOT feed proxies.
The numbers
This project cost about $140 in image-model calls, mostly for the large canvas runs. I ran big, big2 and big3 overnight on November 7 and 8.
| Run | Windows drawn | Cost |
|---|---|---|
| Experiments (style, seams, pilots, downtown) | about 210 | $5.60 |
| First canvas (Downtown) | 764 | $18.80 |
| North (Greenlake, Wallingford) added | 896 | $26.68 with patches |
| Ballard, Magnolia, Capitol Hill | 1,391 | $35.58 with patches |
| East band | 1,080 | $26.56 |
| South band | 999 | $24.26 |
| Transit sprites | 15 sheets | $0.52 |
- The map is 85,952 × 40,320 px (3.5 gigapixels) at 0.165 m a pixel, served as 4,502 tiles.
- Median detail match against the source render was 0.91 to 0.93 on every run.
- Open water is about 40% of the canvas, and repainting it needs about 96 GB of memory per gigapixel, so I repaint in bigger chunks than I do for tiles.
Future iteration
Here’s a fwe more things I’d like to build, assuming my ambition and wallet cooperate:
- Link light rail trains
- Game days and events
- Other image models in place of gpt-image-2.5
- Ships on Elliott Bay and the Sound
- Planes into Boeing Field and seaplanes on Lake Union
- The real sun and weather
- Prints and posters
- Training a cheaper model of my own (this will actually be a pocketbook-positive activity)
- Further expanding the map to the eastside
But yeah, this was a lot of fun, AI is wild, and it’s so fun to go from idea to finished product faster than I ever thought possible.