Building a Fantasy Football Draft Assistance Algorithm: Part Two
Part Two – building the user interface to assist with real-time drafting
In part one, I collected and prepared a bunch of data that I needed to create a fantasy football draft assistant (DAsHA), and exported all of that data to a .csv file. Now that I had all the data, it was time to implement the user interface for DAsHA – I wanted to make a tool into which I could feed (a) the current draft position and (b) players already picked, and return as much data as possible for me to pick the best player per position.
Getting Started
First, I did a bit of data cleanup so that the player scores could be displayed in a user-friend way. I also had to import all the necessary libraries to run my model.
import numpy as np
import pandas as pd
%matplotlib inline
from scipy import stats
import statsmodels.api as sm
import matplotlib.pyplot as plt
from statsmodels.distributions.mixture_rvs import mixture_rvs

# import the csv file
df = pd.read_csv('./prepared_data/2020_ffl_df.csv')

# clean up the kde_icdf column
for i in range(0,len(df)):
    df['kde_icdf'][i] = df['kde_icdf'][i].replace('\n',' ').replace('[','').replace(']','')
    df['kde_icdf'][i] = [float(x) for x in df['kde_icdf'][i].split()]

# more data cleanup for the position names
df['POS']=df['POS'].str.strip()

# add drafted column to track drafted players
df['drafted']=0
Now that my data was ready, it was time to figure out what information I wanted to display.
The idea here is that DAsHA would return a panel of players at each position with the highest projected points and provide context as to which ones would be the best to pick that round. This was done in two ways:
- DAsHA calculated the “marginal” score for each player, with this score representing how many more points this player is expected to generate compared to the best player at the same position who will be available in the next round.1
- DAsHA constructed a series of confidence intervals for each player. These confidence intervals would let me select players based on variance as well as projected points.2
Finally, since I had to act on all information, I needed DAsHA to generate charts and graphs that displayed all of these comparisons. Since I wanted DAsHA to be a heuristic helper (as compared to an out-and-out predictive tool), my goal was to provide as much data for myself to make an informed decision based on the variance/distribution of point projections in addition to the raw point totals.
Comparing the players
DAsHA needed three different arrays to accomplish my goals, namely
- The list of best players per position for the round
- The list of the best players per position for the next round (to calculate the marginal score)
- The list of the second best players for each position, to provide more information for my draft decision.
I wrote each collection as a separate method in my Jupyter notebook so it could be easier to extend in the future. Below is my implementation of each method.
### BEST PLAYERS ###
def compare_best_players(positions):
    best_players = []
    j = 0
    for j in range(0, len(positions)):
        k = 0
        for k in range(0, len(df)):
            if df['drafted'][k] == 1:
                k += 1
            if df['drafted'][k] == 0:
                if df['POS'][k] == positions[j]:
                    if len(best_players) > j:
                        if df['pts'][k] > best_players[j][2]:
                            best_players[j] = [df['POS'][k], df['Name'][k],
                                df['pts'][k], df['Draft Position'][k]]
                            k += 1
                        if df['pts'][k] <= best_players[j][2]:
                            k += 1
                    if len(best_players)<=j:
                        best_players.append([df['POS'][k], df['Name'][k],
                            df['pts'][k],df['Draft Position'][k]])
                        k += 1

    return best_players

### BEST PLAYERS IN THE NEXT ROUND ###
def compare_best_players_next_round(positions, next_available_pick):
    best_players_next_round = []
    j = 0
    for j in range(0, len(positions)):
        k = 0
        for k in range(0, len(df)):
            if df['drafted'][k] == 1:
                k += 1
            if df['drafted'][k] == 0:
                if df['POS'][k] == positions[j]:
                    if len(best_players_next_round) > j:
                        if df['Draft Position'][k] < next_available_pick:
                            k += 1
                        else:
                            if df['pts'][k] > best_players_next_round[j][2]:
                                best_players_next_round[j] = [df['POS'][k], df['Name'][k], df['pts'][k], df['Draft Position'][k]]
                                k += 1
                            if df['pts'][k] <= best_players_next_round[j][2]:
                                k += 1
                    if len(best_players_next_round) <= j:
                        if df['Draft Position'][k] < next_available_pick:
                            k += 1
                        else:
                            best_players_next_round.append([df['POS'][k], df['Name'][k], df['pts'][k], df['Draft Position'][k]])
                            k += 1

    return best_players_next_round

### SECOND BEST PLAYERS ###
def compare_second_best_players(positions, best_players):
    second_best_players = []
    j = 0
    for j in range(0,len(positions)):
        k = 0
        for k in range(0,len(df)):
            if df['drafted'][k] == 1:
                k += 1
            if df['drafted'][k] == 0:
                if df['POS'][k] == positions[j]:
                    if len(second_best_players) > j:
                        if df['Name'][k] == best_players[j][1]:
                            k += 1
                        else:
                            if df['pts'][k] > second_best_players[j][2]:
                                second_best_players[j] =
                                    [df['POS'][k], df['Name'][k],
                                        df['pts'][k], df['Draft Position'][k]]
                                k += 1
                            if df['pts'][k] <= second_best_players[j][2]:
                                k += 1
                    if len(second_best_players) <= j:
                        if df['Name'][k] == best_players[j][1]:
                            k += 1
                        else:
                            second_best_players.append([df['POS'][k], df['Name'][k],
                                df['pts'][k], df['Draft Position'][k]])
                            k += 1
    return second_best_players
Now that I had the methods for populating the three arrays, I could put them all together like this:
# generate the current draft position
current_draft_number = 0
i = 0
while current_draft_number == 0:
    if df['drafted'][i] == 1:
        i += 1
    else:
        current_draft_number = df['Draft Position'][i]

# threshold for next available picks
next_available_pick = current_draft_number + turns_to_next_pick

# List of possible positions to draft for
positions = ['QB','RB','WR','TE','K','DEF']

# identify best choices at each position
best_players = compare_best_players(positions)

# collect the second-best choices for each round
second_best_players = compare_second_best_players(positions, best_players)

# identify best choice in next round at each position
best_players_next_round = compare_best_players_next_round(positions, next_available_pick)

# make marginal comparisons and append them to the best_players list
for j in range(0,len(positions)):
    marg = best_players[j][2] - best_players_next_round[j][2]
    best_players[j].append(marg)
(If you’re curious, the full code for DAsHA’s UI can be found on Github here).
Visualizing the results
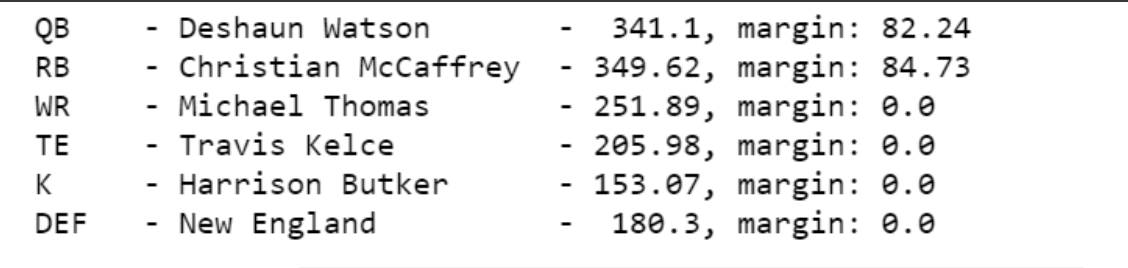
Now that I had my player comparison information, it was time to build the scaffolding to visualize these results in a user interface! Since I wanted the most important information to help me draft first (I only have 90 seconds per round), I started off just showing a table of the top players:
# print recommendations menu
for i in range(0,len(positions)):
    print(f"{best_players[i][0]:{5}} - {best_players[i][1]:{20}} - {round(best_players[i][2],2):{6}}, margin: {round(best_players[i][4],2)}")
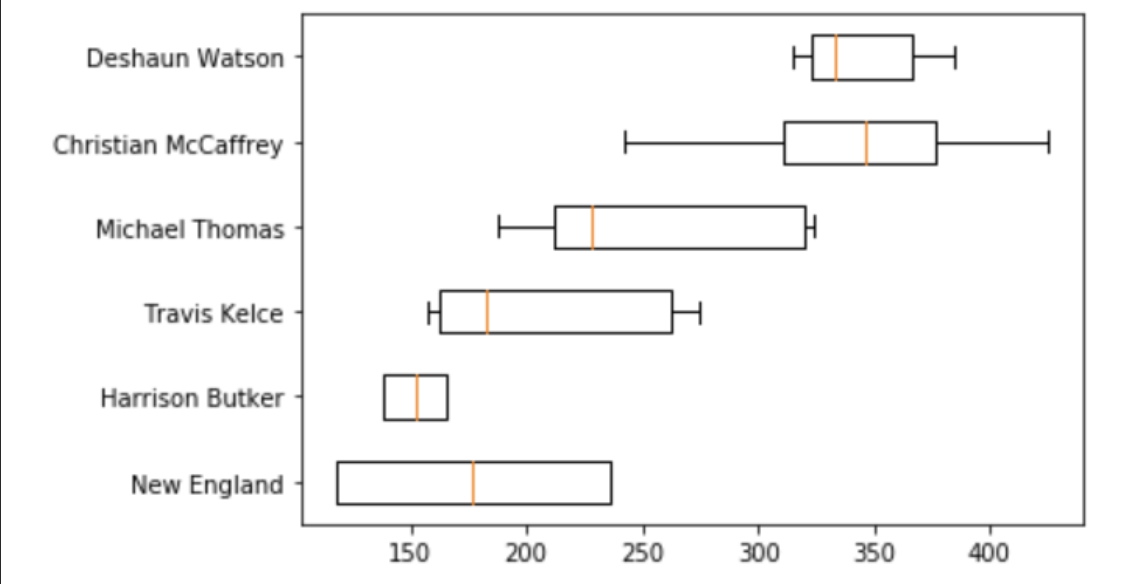
Then, I visualized the scores and confidence intervals for these top players.
# identify index values (based off Yahoo! draft position) to create the boxplots
DEF = best_players[0][3] - 1
K = best_players[1][3] - 1
TE = best_players[2][3] - 1
WR = best_players[3][3] - 1
RB = best_players[4][3] - 1
QB = best_players[5][3] - 1

# boxplots of recommendations
box_plot_data=[df['kde_icdf'][QB], df['kde_icdf'][RB], df['kde_icdf'][WR], df['kde_icdf'][TE], df['kde_icdf'][K], df['kde_icdf'][DEF]]
plt.boxplot(box_plot_data, vert=False, labels=[df['Name'][QB], df['Name'][RB], df['Name'][WR], df['Name'][TE], df['Name'][K], df['Name'][DEF] ])
plt.show()
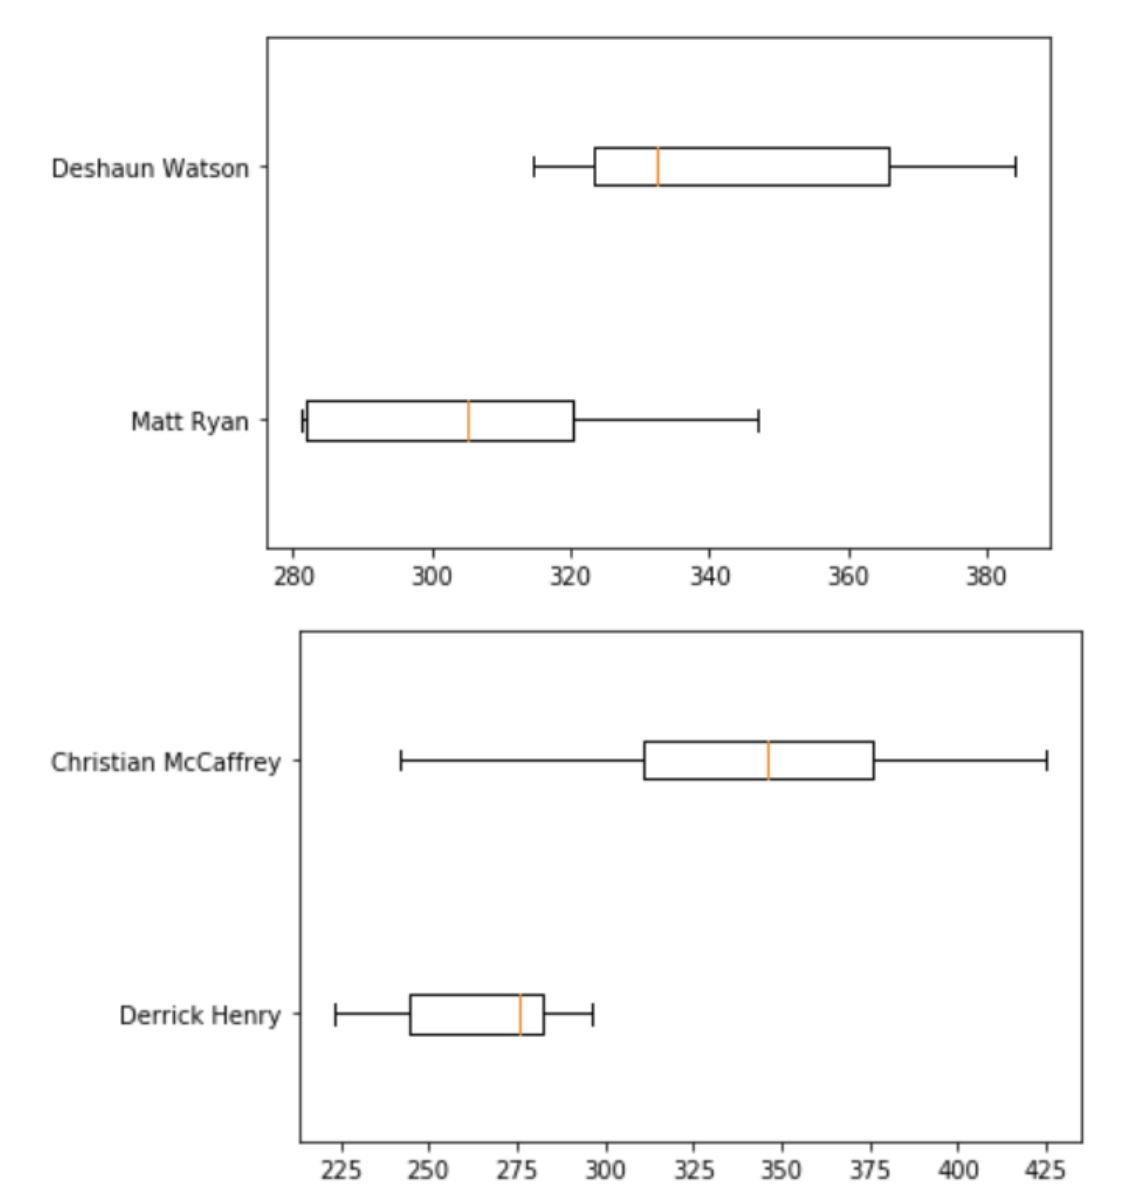
And finally, I grouped the second-best players by position,
# find the top two second-best
top_seconds = [second_best_players[0][2], second_best_players[1][2], second_best_players[2][2], second_best_players[3][2],second_best_players[4][2],second_best_players[5][2],]

first_comparison = top_seconds.index(max(top_seconds))

top_seconds[first_comparison] = 0

second_comparison = top_seconds.index(max(top_seconds))
and made box plots for each of them.
# create boxplot of second best recommendations
first_best_first = best_players[first_comparison][3] - 1
second_best_first = second_best_players[first_comparison][3] - 1
first_best_second = best_players[second_comparison][3] - 1
second_best_second = second_best_players[second_comparison][3] - 1

box_plot_data=[df['kde_icdf'][second_best_first], df['kde_icdf'][first_best_first]]
plt.boxplot(box_plot_data, vert=False, labels=[df['Name'][second_best_first], df['Name'][first_best_first]])
plt.show()

box_plot_data=[df['kde_icdf'][second_best_second], df['kde_icdf'][first_best_second]]
plt.boxplot(box_plot_data, vert=False, labels=[df['Name'][second_best_second], df['Name'][first_best_second]])
plt.show()
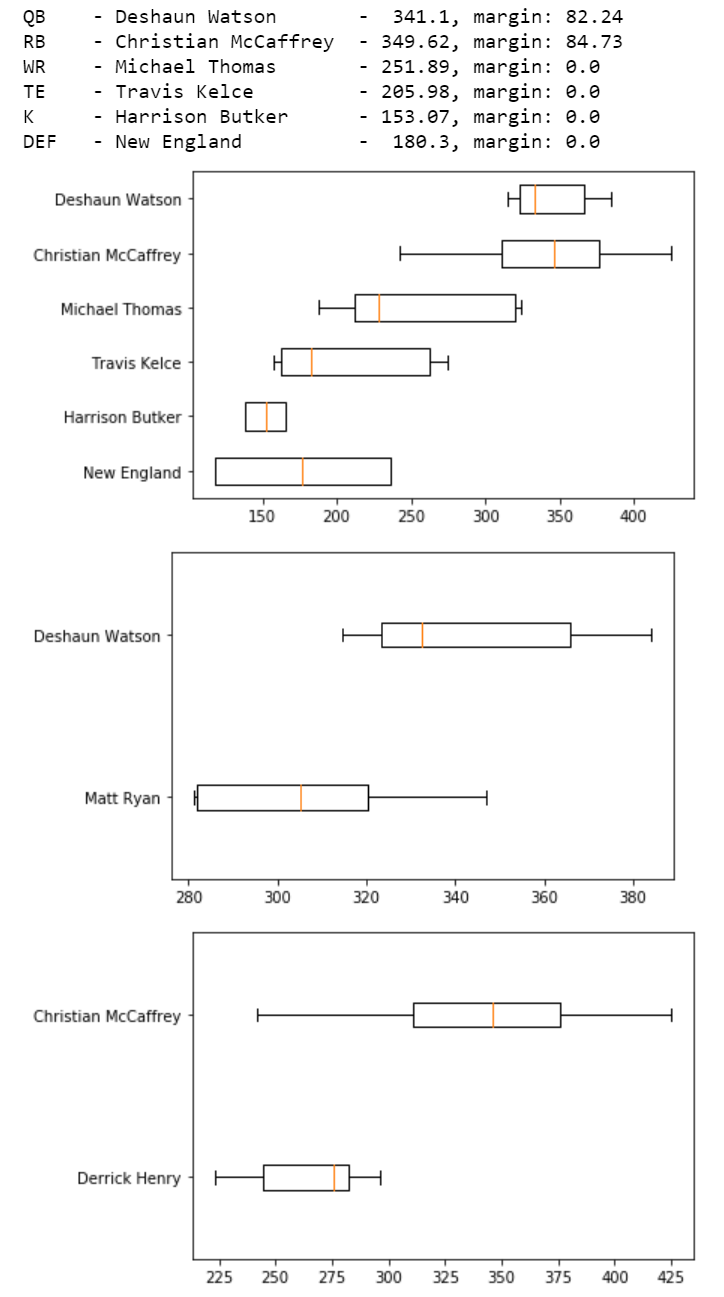
Tying all of these visualizations together led to a final output that looked something like this:
Running DAsHA in real-time
I’ll admit, I definitely hacked together this part, but when I was writing it the draft was only 20 minutes away! Basically, what I did was take advantage of my format; since DAsHA ran inside a Jupyter Notebook, I wrote little while loop to return True unless it was my turn. This way, I could run DAsHA live and feed it inputs while my draft was going:
your_turn = False
while your_turn == False:
    new_draft = input('Who was the last pick?')
    if new_draft != '':
        temp_index = df['Name'].str.find(str(new_draft.strip()))
        temp_no = temp_index.values.argmax()
        df['drafted'][temp_no] = 1
        new_draft = ''
    your_turn_input = input('Is it your turn?')
    no_set = {'no', 'n', 'N', 'No'}
    if your_turn_input in no_set:
        your_turn = False
    else:
        your_turn = True
Now that I had a rudimentary system for tracking state, I could run DAsHA live during my draft! All I had to do was feed it the (a) draft number and (b) the player taken, and when it was my turn it would show me the various visualizations that I put together earlier in this post. Pretty nifty!
Conclusion
While I hadn’t really set a concrete goal for DAsHA other than “beat ESPN’s player projections so that I could draft more shrewdly than my friends”, I’d say this project was a rousing success. On top of having the best draft out of all my friends (my team is the one on the top in the below image that has sadly taken a turn for the worse),
I learned a lot about estimating probability distributions using Gaussian KDEs (read part one for more details on that) and I had fun hacking a Jupyter notebook into a UI that I could use to help me draft in real-time.
Unfortunately, the end of this story is not a happy one; despite my excellent draft, my record this season is only 5-5. Perhaps for my next project I’ll use some data science to help me with my week over week player projections so I stop leaving my good players on the bench!
Footnotes
-
For example, if the top RB available now is projected to get 150 points, but the top RB that will be available during your next pick is projected to get 100 points, the marginal score will be 50. However, if the top kicker available this round will also be available next round, the marginal score for drafting that kicker will be 0. In general, you should draft the player with the highest marginal score. ↩
-
I wanted to include a confidence interval for each player so to represent the upside / downside potential. Depending on my draft position, I could be willing to accept a player with a lower median projection but higher upside as opposed to locking in a player with a higher median point projection, but very low variance. ↩